If you’ve just Googled, “What is content strategy?” I’m going to assume you are currently doing content marketing in some way. “Content strategy” is a little further up field than just “content marketing,” so it seems safe to assume you have some baseline knowledge. It’d be like someone searching “What is the West Coast Offense?” We can assume those people watch football, at least a bit.
Therefore...
I’m not going to define content strategy in this article.
If you’re looking for a definition, here are some good articles by Distilled and HubSpot.
I’m not going to give you a step-by-step process.
If you’re looking for step-by-step, high-level plans, we have an amazing article right here and another here. You can follow those steps specifically and see results.
What I will do is give you a look at what B2B content strategy looks like on a daily basis. If you don’t see lots of numbers and screenshots in your B2B content planning process like the ones below, you are missing big opportunities.
Below, you’ll find a number of different analyses and reports we run every day as part of the content strategy we deliver for Nectafy and its clients. We’ll explain each and show the value you get from them.
1. Blog Post Rewrites
If one of your blog posts has ranked for a big keyword and generated a lot of consistent traffic for years, be careful: It will most likely slip in Google’s search results soon. That’s because Google doesn’t like old content.
At Nectafy, managing which posts to rewrite to recoup lost traffic is a big part of our content strategy. In fact, we discovered this important piece of the puzzle years ago when one of our B2B client’s organic traffic tanked. We figured out old posts all started to drop.
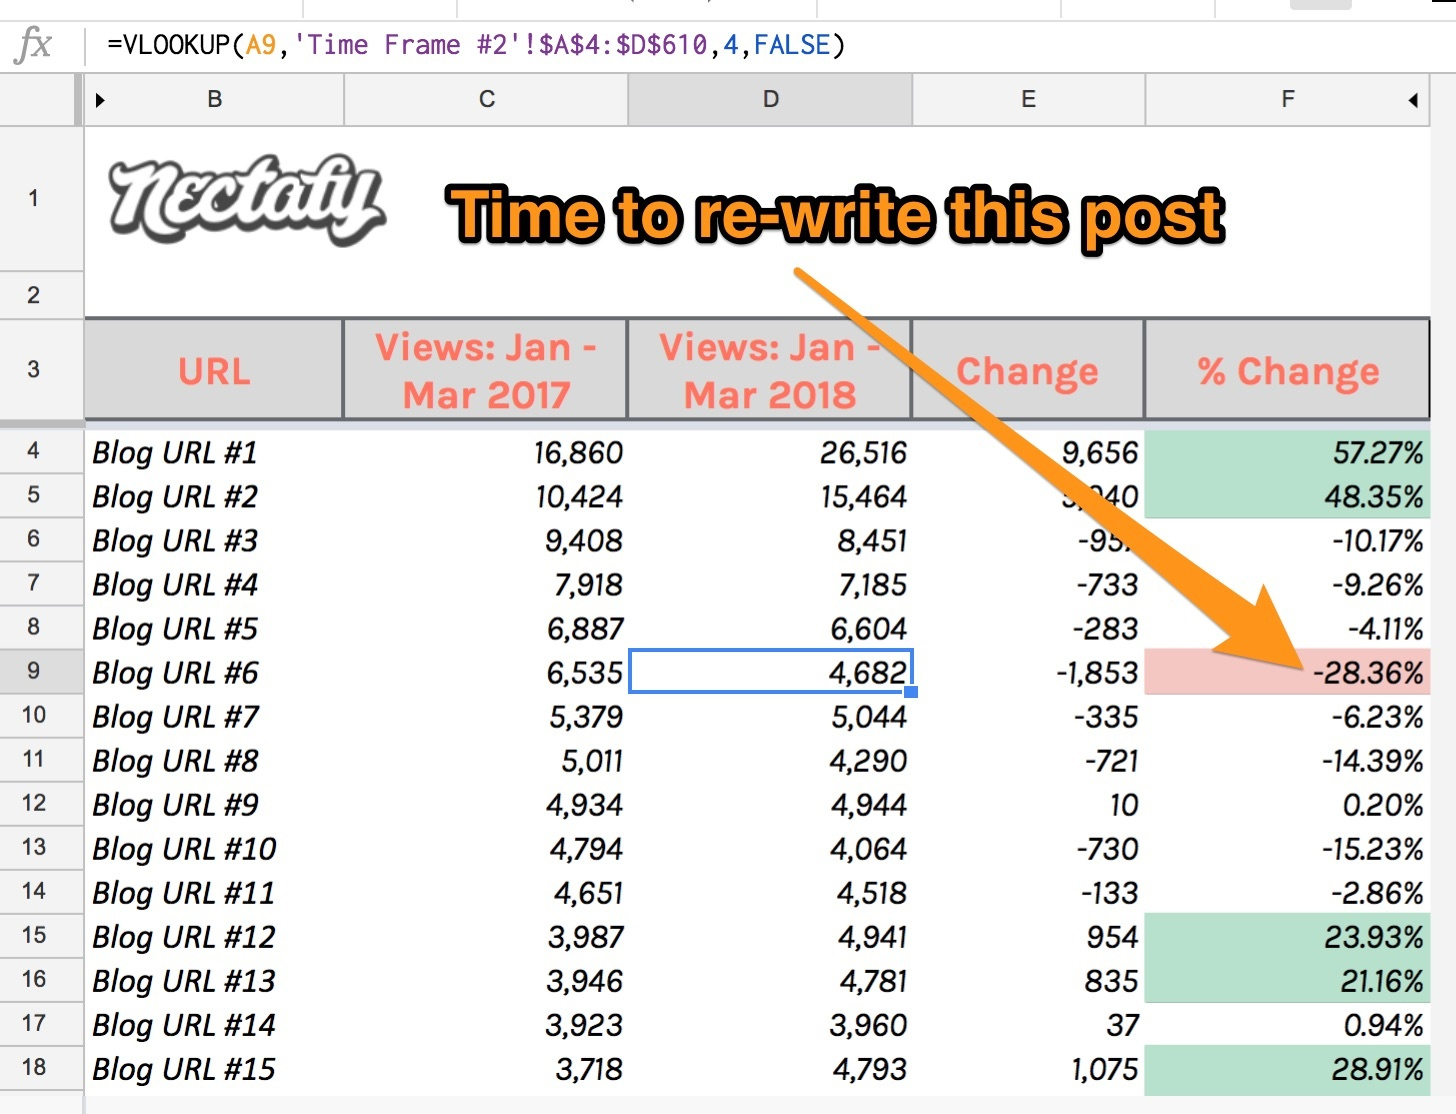
After refreshing (rewriting or adding to) seven old posts, blog views increased by 37%. That was equal to 27,000 additional blog views after the posts were republished.
Here is the spreadsheet template we use to highlight posts that are losing traffic. It makes it easy to compare hundreds of blog posts across time frames so you can spot the biggest losers.
Download Now: How To Generate Meaningful Organic Traffic To Your Website In 90 Days
2. Striking-distance Keywords
Everyone knows this by now, but searchers rarely go to page two of Google results. In fact, position one in Google on page one gobbles up 32% of the clicks, according to this study done by Backlinko. Here’s the takeaway:
- If you show up on page one of Google results for a keyword, you are bringing people to the site.
- If you show up on page two of Google, you are not getting any visitors from that keyword.
Therefore, the biggest opportunity in your B2B content strategy is not your next piece of content. It’s likely a piece of content you previously posted that got stuck on page two or three of Google results. It’s close to bringing in results but is not currently doing so.
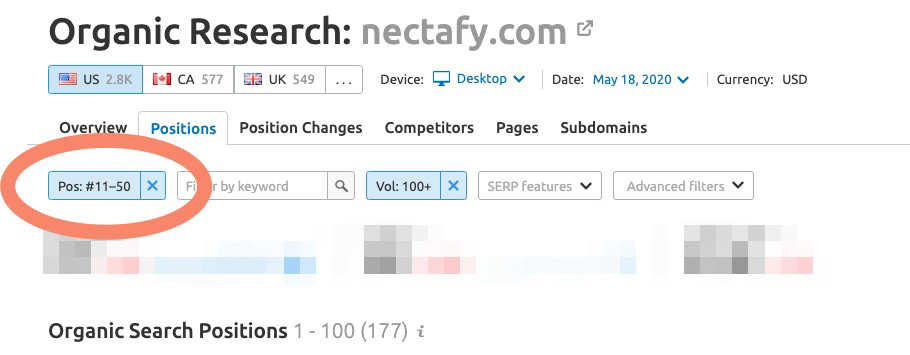
SEMRush is an SEO tool that allows you to sort your current keyword rankings by position (among other things).
In the screenshot below, you’ll see we’re sorting for positions 11-50 in Google. We’re looking for our best opportunities on pages two through five of Google results. If we find a good opportunity stuck on page two, we could do a few simple things to potentially flip it onto page one:
- Add more content
- Add a video
- Internally link to it from related pages
- Write a guest post on another site and link to it
Any of those are likely easier than writing your next full post, and more impactful.
See Also: The Anatomy & ROI Of A One Million-View Blog Post
3. Keyword Difficulty & Hit Rate
Keyword difficulty
Another strategy for getting B2B content to rank in Google is to write about topics your website has the chance to rank for.
That sounds insanely simple and it is. It’s like saying to a basketball player, don’t go for a dunk if you can’t dunk. Maybe try for a layup. But tons and tons of companies try for dunks when they can’t do it.
In other words, if your invoicing software company gets just a handful of organic visitors per month, don’t try to go after the keyword “invoicing.” YOU HAVE NO SHOT! Build up to it.
Again, we use SEMRush for the keyword difficulty (KD) metric, which shows how hard it is to rank for any single keyword. A 0/100 score is the easiest, and 100/100 is the hardest. There are two ways to determine the right level of difficulty:
- If you currently rank for some keywords, what is the average keyword difficulty for those on page one of Google? If you rank on page one for keywords with an average of 45/100, you’ll have more success writing about keywords in that range.
- If you don’t have any keyword rankings, check out your website’s domain authority (DA) by Moz. That is conveniently also on the 0-100 scale. If your domain authority is a 30, try to find keywords with a difficulty score in that range.
Take a look at this article, item six for a great description of how to use keyword difficulty in your strategy.
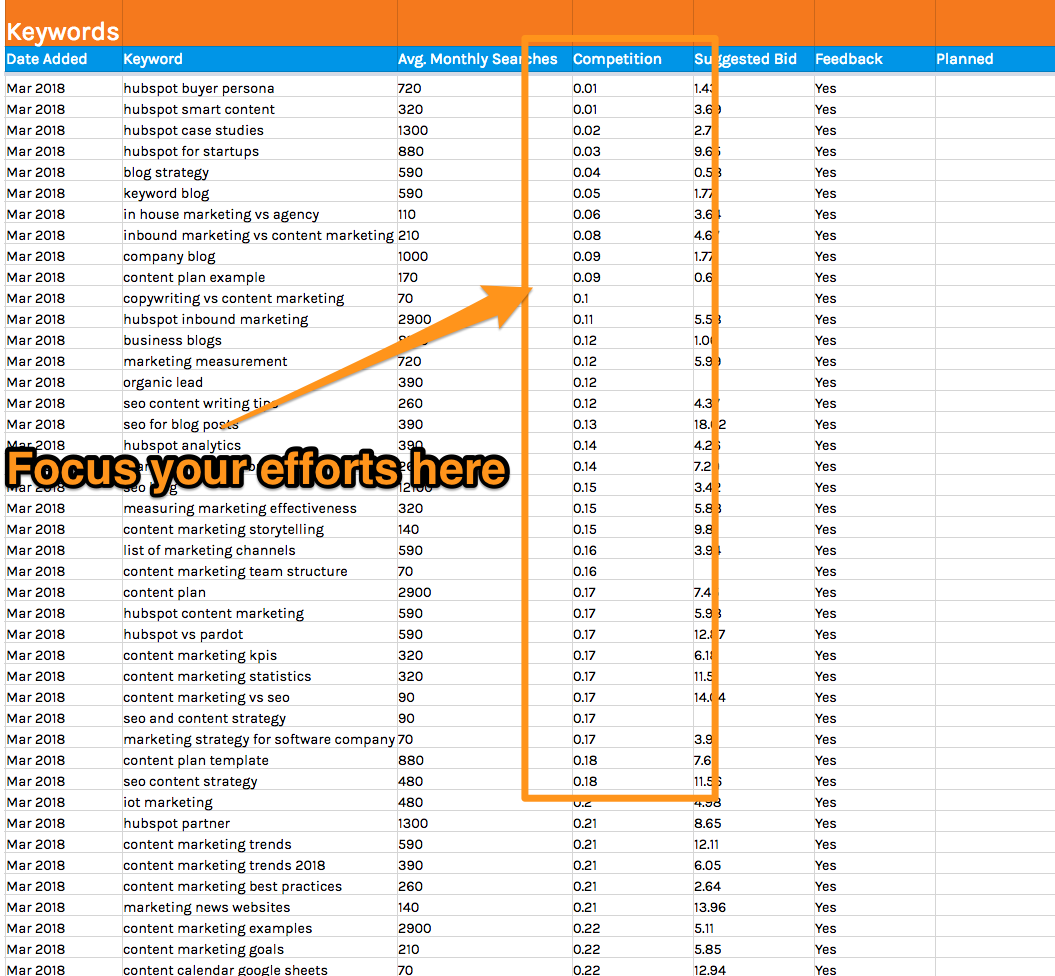
Here’s a screenshot of a bunch of potential keywords for Nectafy. If we really want to get some rankings going right away, we should focus on the least competitive.
Keyword hit rate
Just about every piece of content you create should have a main keyword to target. To see if your content is working, make sure you measure the results.
Here is a chart with real data from a Nectafy client that went from 600 to 6,000 organic visits in 12 months.
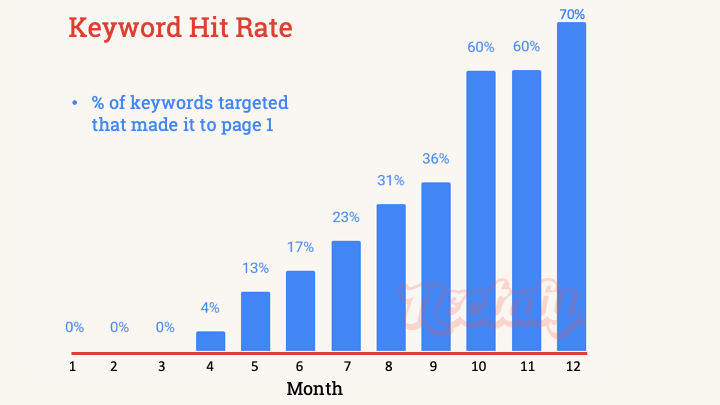
Here’s what it says:
- In months one through three, zero percent of the keywords we targeted ranked on page one of Google. That’s normal for just starting out—it takes time for Google to trust you.
- By month 12, 70% of all the keywords we went after in the previous year ranked on page one of Google.
That is a very important number to know. Investing in something that initially had a 0% success rate was a leap of faith. Investing in year two (with a success rate of 70%), was a statistically good decision.
4. Leads Generated By Blog Post
The ultimate goal of creating content for your business is to generate quality leads that could turn into customers. Keyword rankings bring the visitors. Visitors turn into leads. Leads turn into customers. So the ultimate measures of success with B2B content are new, quality leads generated and new customers closed.
Below is a spreadsheet template we built to calculate how well each blog post is doing at generating tier A (the highest quality) leads. We use HubSpot to get this data, and then the spreadsheet to analyze it.
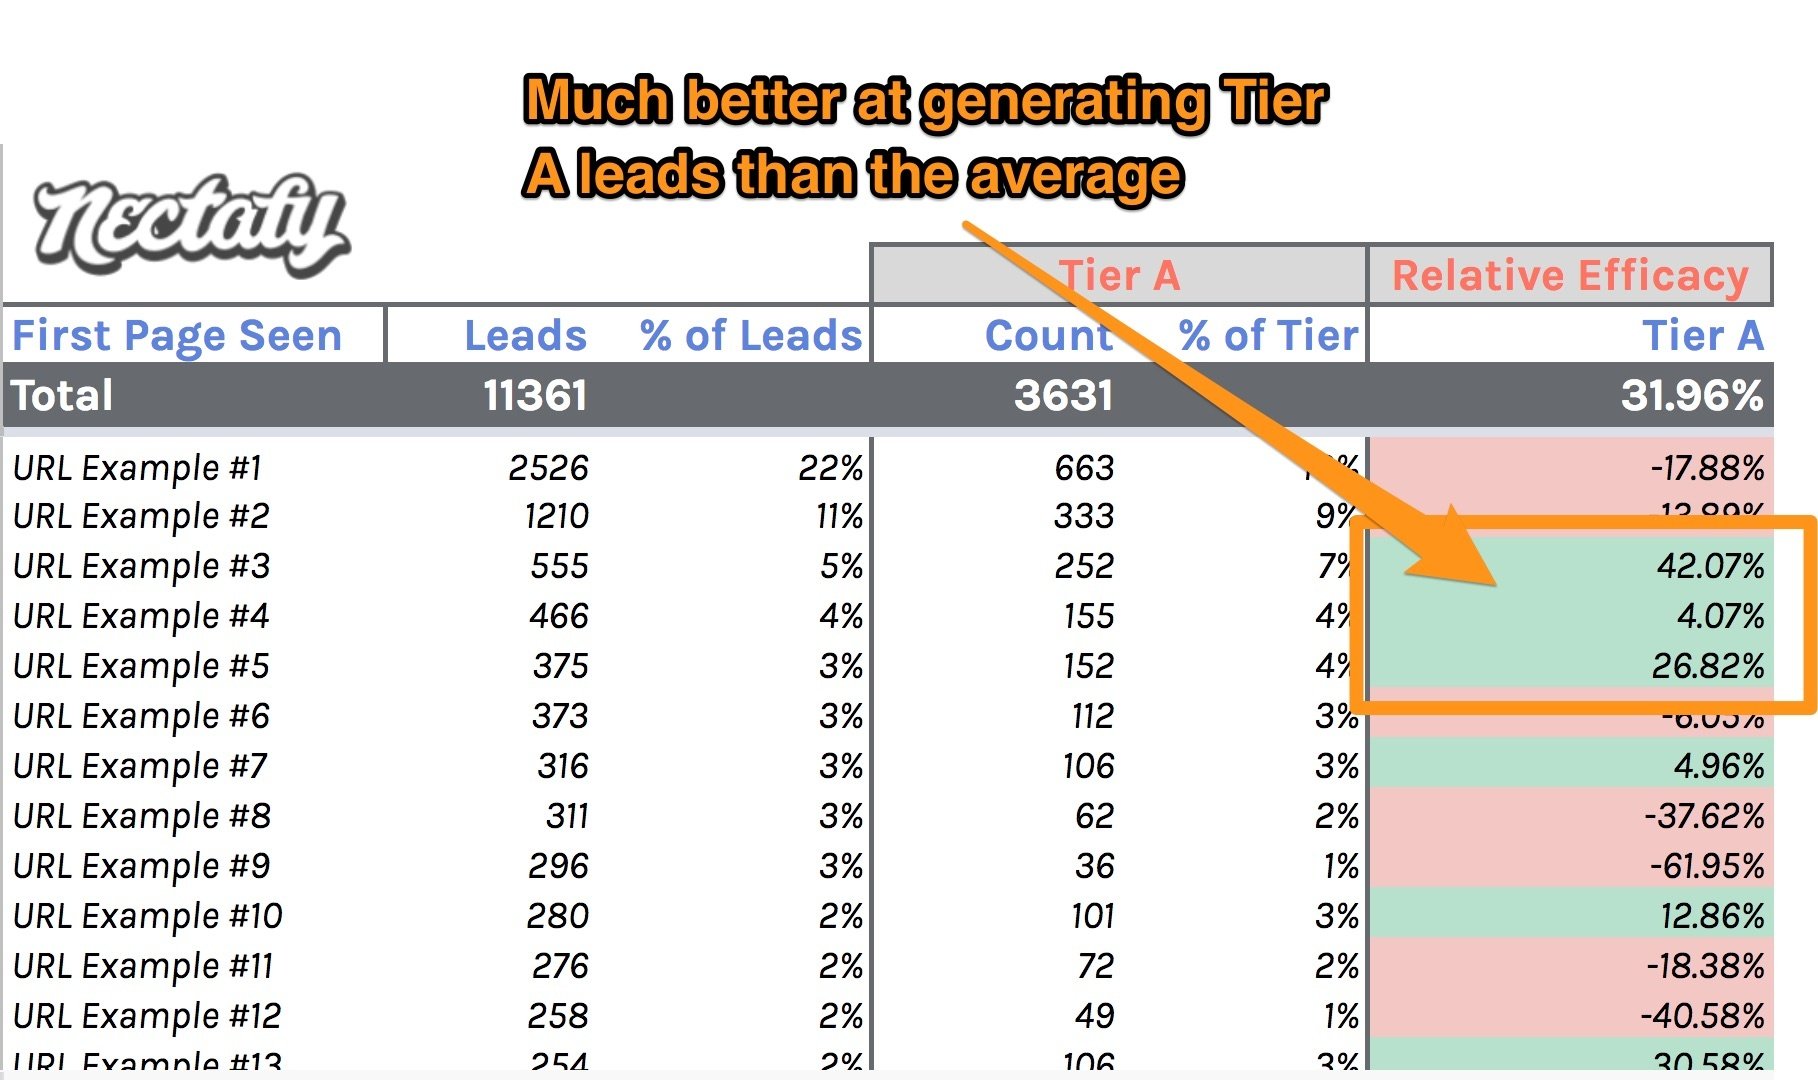
- URL Example #3 brought in 555 leads (5% of all leads), and 252 (7%) of those are tier A leads.
- Therefore, it is 42% better at bringing in higher quality leads than you’d expect.
By analyzing our content in this way, we can see which topics resonate the most with the best leads we want to attract. That drives our B2B content strategy toward better business results.
You can download this spreadsheet template here:
No-Frills Blog Lead Analysis Template
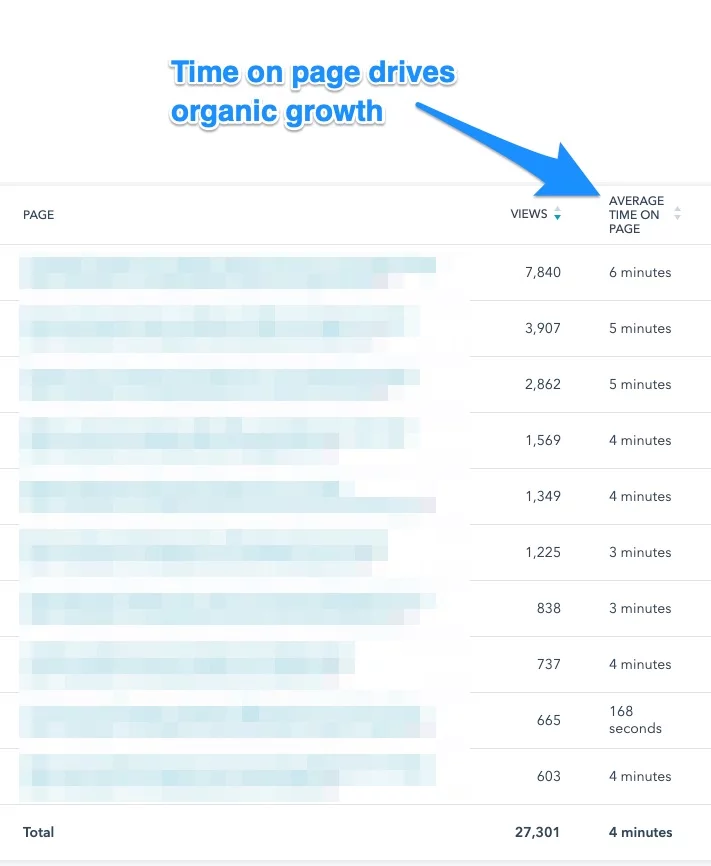
5. Time On Page (As A Ranking Factor)
Google wants to serve up quality results for any given keyword. One way to measure quality is to look at how long people stay on a page on average. That’s why “time on page” (a metric you can find in Google Analytics or HubSpot) is highly correlated with keyword rankings. The longer people read your content, the higher Google places you in the results.
We did a study of 2,000 B2B blog posts to analyze this connection between time on page and keyword rankings. Here is a chart from that study:
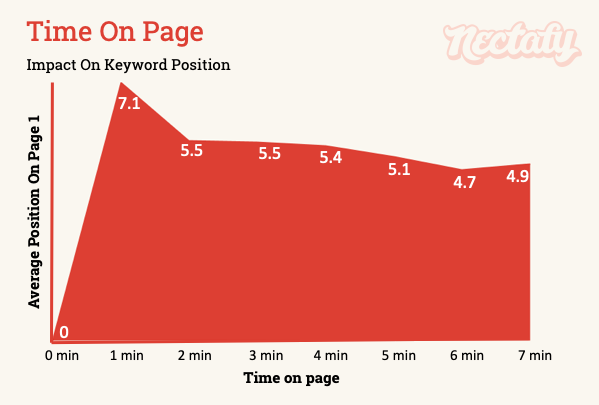
Takeaways:
- Blog posts with no time on page (people don’t stay around to read them) have no keyword rankings whatsoever. (They failed.)
- As the minutes go up, the rankings on Google’s page one increase.
- If you want keyword rankings that are higher up on page one of Google, improve the average time spent on your blog posts.
We use HubSpot to track this metric for our web pages. Take a look at the example below. The table is sorted from most blog views to least. Notice how average time on page goes from most to least as well? That’s no coincidence.
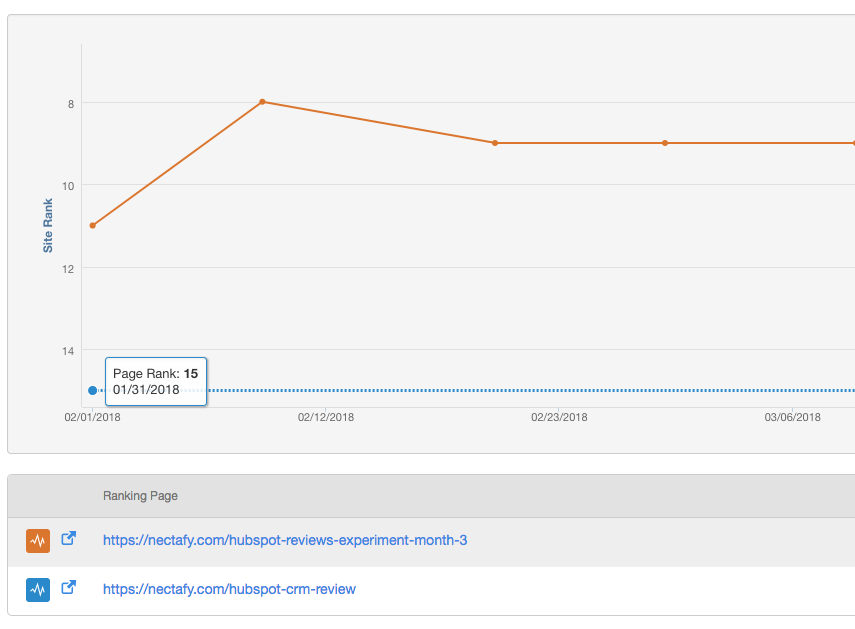
6. Keyword Cannibalization
Sometimes, some of your own pieces of content may even compete on a given keyword. (For you, that might happen sometime down the road in your B2B content journey.) That’s what happened to us in the screenshot below with the keyword “HubSpot reviews.”
We had two pages ranking for the same keyword (ranking at 11 and 15 respectively). When one dropped out (where you see the dotted line), the other jumped to 8. One article on page one is better than two in the middle of page two.
If you have two blog posts on a similar topic both ranking on page two, the posts are cannibalizing one another: They are both doing OK, but not well enough to get to page one, where the majority of your audience will find the post—and you.
Keep an eye out for this happening. When possible, combine the two posts into one bigger post, and redirect the old URL to the new URL. That’ll combine the authority on both posts into one and likely push you onto page one of Google.
Wrapping Up
Hopefully by now you’ve gotten what you came for: You already know what content strategy means—you’re looking for ways to supercharge it.
If you were to pick just one of those six B2B content strategies, I bet you’d start to see better results.
You can do all these things on your own, but if you’d rather partner with a team of experts who can lead the way, talk to us. We’ll have an honest conversation about how to get meaningful business results for your company using growth content.