

Disclosure: We only recommend products we use here at Nectafy. Some of the links in this article are affiliate links that may provide Nectafy with a small commission at no cost to you.
Generating blog content for your business can be an uphill battle at times.
Low engagement, missed keyword rankings, and a lack of traffic are just a few of the things that could be crippling your content, leaving your site in the dust compared to your competitors.
That’s why it’s important to always keep your eyes on the prize with every piece of content you produce for your website—to help ensure you’re not just creating filler posts that your audience glosses over.
This is where blog analytics comes into play.
Throughout this post, we’re going to take a look at the following topics revolving around the concept of blog analytics:
- What are blog analytics?
- What are some of the top blog analytics tools?
- What are the top metrics to track your blog performance?
- (Bonus) Free Blog Analytics Dashboard Templates
What are blog analytics?
Blog analytics are sets of data points one uses to gain a better understanding of their produced content for their website’s blog.
Simply put, it’s a helpful way to gauge whether or not the blog posts you’re writing for your business are successfully helping to grow your website.
By regularly checking in with your content’s blog analytics you will gain valuable insights into the conversions, engagement, and traffic your posts generate.
Plus, you’ll be able to see which content is not as attractive for your audience, which may signal the need to pivot to a new content strategy.
Where can you access all this data?
Blog analytics tools provide access to tons of metrics that will help you consistently improve your performance.
Top 4 Blog Analytics Tools
1 Google Analytics 4
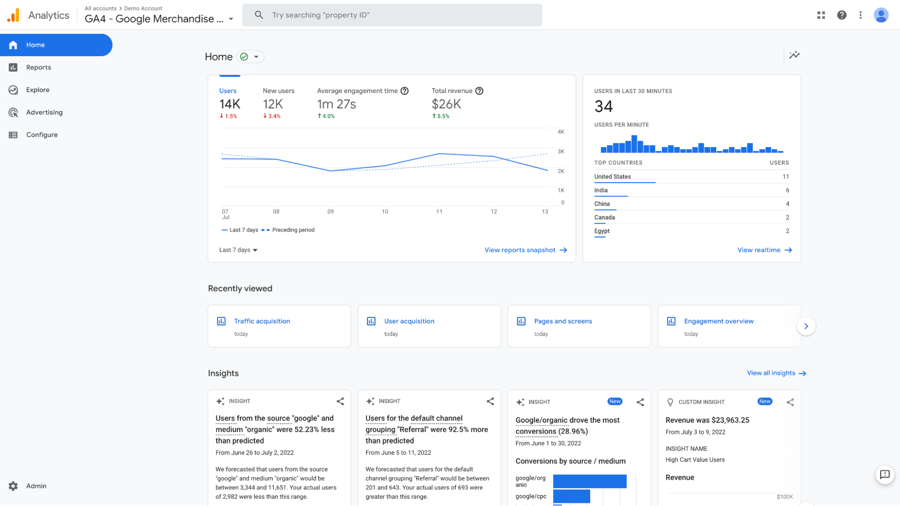
Google Analytics 4 (GA4) is a website analytics tool that monitors user engagement and traffic to your website.
In other words, it helps you understand who your audience is and what they are doing when they land on your site.
GA4 is the latest version of Universal Analytics and it includes powerful features that allow you to track the customer journey across multiple platforms.
With all metrics in GA4 being tracked as events, you can get a better understanding of how users are interacting with your content, and identify the pages and screens with the highest engagement levels.
Setting up a GA4 property on your website is easy. Once your property has been set up, you will have access to a vast amount of data to help you better understand your blog performance.
Pricing: Free
2 Google Search Console
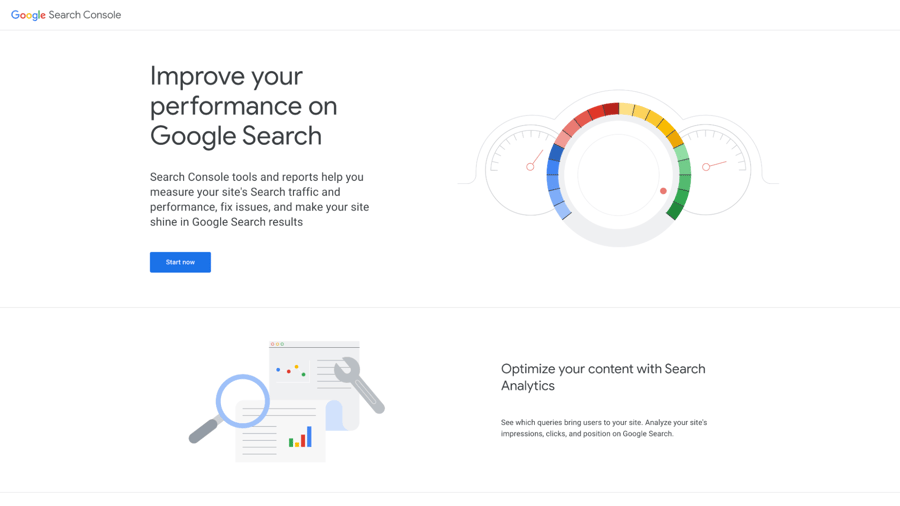
Google Search Console (GSC) is another tool in Google Marketing Platform. It provides access to data that will help you better understand how your site is performing on Google’s search engine results page.
With GSC you have access to key metrics like impressions, clicks, average position, and Click-Through Rate (CTR), which you can keep track of within GSC to view both current and historical performance.
You can further drill down into these metrics by viewing customer search queries and specific pages across your website to understand what queries and blogs are driving more traffic to your site.
Not only can you gain insights into the performance of your blog, but you can also access data on mobile performance, crawlability, indexing, and more to help you improve your overall website ranking.
Pricing: Free
3 HubSpot
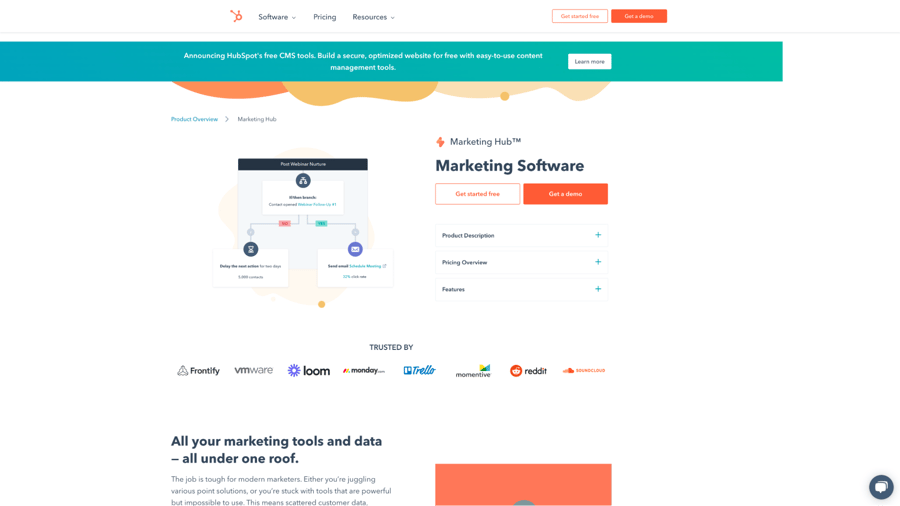
HubSpot allows you to track your inbound marketing strategy all from one place.
More specifically, you can monitor data from your paid ads (PPC), social media, and search campaigns to gain a full picture of your marketing performance.
With HubSpot Marketing Hub you can:
- Analyze individual blog posts and pages to understand how they are engaging your audience
- Host videos and access data into their performance
- Create and analyze CTAs to convert visitors into leads
- Plan your content strategy
- Optimize your content types
The benefit of using a tool like HubSpot is that it gives you the capability to track your entire customer lifecycle from start to finish. This means you can track users as they move through the sales funnel—from the time they view the blog to the time they become a customer—. making it possible to tie blog performance to your bottom line.
Pricing: Free, with paid plan options starting at $45/mo
4 Semrush
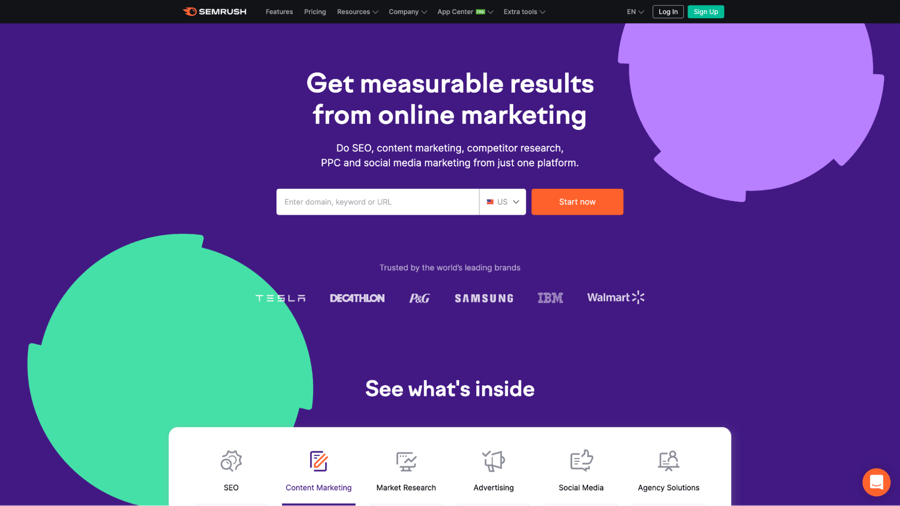
Semrush is a search engine optimization (SEO) tool that enables you to combine data from all the channels that contribute to your website performance.
You can use Semrush to help you optimize your existing content or discover new trending topics for your blog content.
Its features facilitate your ability to create content that ranks by helping you:
- Find new topics that resonate with your audience
- Gain actionable insights to improve your blog’s SEO
- Monitor your content performance in real-time
- Track your blog’s reach and mentions
Additionally, you can use its competitor tool to uncover your competitors’ presence on search engine results pages (SERPs).
Pricing: Paid plans starting at $119.95/mo
Top 6 Metrics To Track Blog Performance
The metrics you choose to track blog performance will depend on your goals and what part of your buyer funnel the content falls under.
Common overarching goals for blog posts include the following:
- Increase brand awareness
- Increase traffic and grow keyword rankings
- Improve reader engagement across website
- Produce more leads
Let’s take a look at the most common metrics you can use for your blog analysis, relevant across all parts of your buyer funnel:
1 Traffic
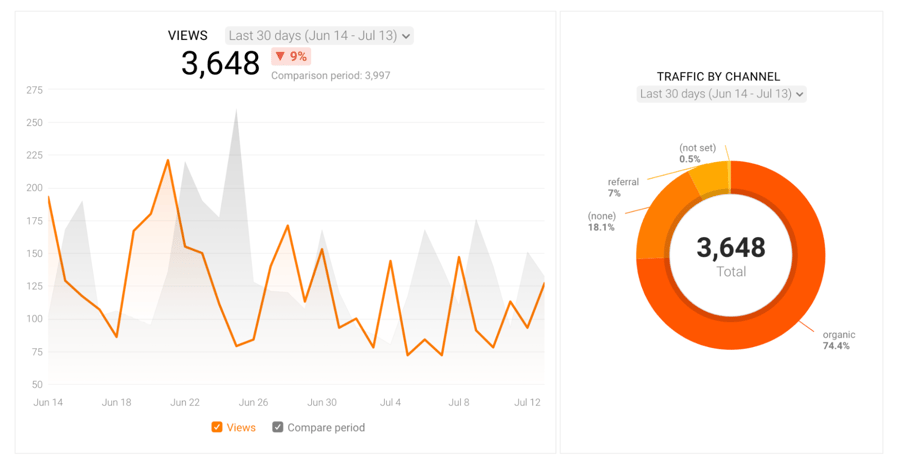
Traffic is the most important metric you can use to track blog performance because it measures how successful you are at getting users to your blog.
If your overall goal is to generate more leads with your content, you will not be able to accomplish this without traffic. (Low traffic means users are not finding your blog.)
You can further drill down into your traffic performance by looking at traffic by channel. With this, you will be able to identify the channels that are driving the most traffic and focus on growing the top performers.
For instance, if one of the goals for your blog is acquiring keyword rankings and improving organic traffic, you would track the organic channel, since this is the main channel associated with these items.
2 Social Shares
Social shares are a great way to measure the likability of your content. This metric shows the number of times your blog was shared on different social sites.
Nowadays, conversations about blog posts rarely happen in the blog comments, as users would much prefer to use their social channels for this.
To encourage your audience to promote your posts, include social sharing buttons across your blog pages.
3 Keyword Rankings
A keyword ranking gives you an indication of a web page's position on SERP for a particular keyword.
You can use this metric to understand how your blog is ranking for the targeted keyword. Naturally, if you have optimized your blog correctly, you would expect your ranking to improve over time.
You can also use keyword ranking to track related keywords you might be ranking for that you did not rank for previously. This can help you uncover new opportunities to improve your organic search performance.
4 Engagement Rate
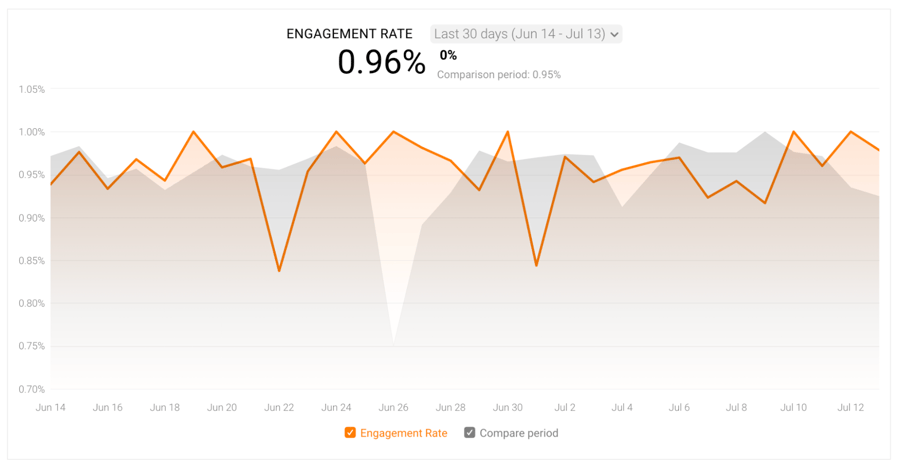
Engagement rate is a new metric introduced by GA4. This metric will show you the number of engaged sessions divided by the number of sessions.
In other words, it will help you understand how long a user stays and interacts with your website.
You can use this metric to answer crucial questions about whether users are finding what they are looking for when they arrive on your page, and what blogs you can optimize to improve performance.
When tracking engagement rate, make sure to monitor this metric alongside others (time per pageview, average time per session, exit rate) to really determine the effectiveness of your content.
5 Backlinks
Backlinks will help you measure the number of websites that link back to your blog or pages. Having good-quality backlinks is a key ranking factor for search engines.
Focusing on increasing your backlinks is also a great way to affect your traffic, because as you gain more and more backlinks, you are exposed to the traffic and audience of your referring domains.
6 Conversions
Lastly, you can use conversions to help you measure the number of actions a user takes from your blog post.
Conversions can be anything that is relevant to your objective—for instance, you may want people to submit a form, subscribe to a newsletter, start a conversation, and more.
When working on your blog post, make sure to create clear conversion paths to help you measure the effectiveness of your content.
Databox: All Your Blog Analytics In One Place
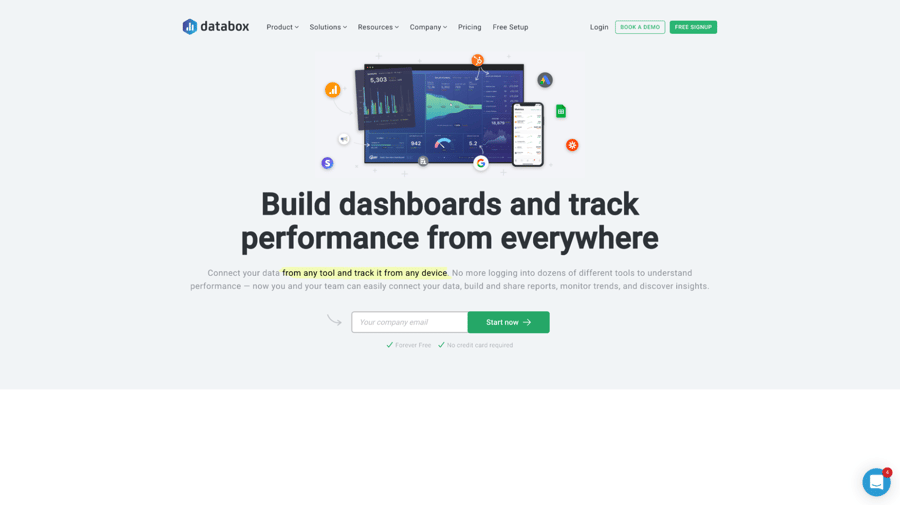
Databox is a business analytics platform aimed at helping companies monitor, analyze, and improve the performance of the metrics that matter the most. It allows you to mix and match metrics from different sources in one dashboard, giving you a complete view of your performance.
This is important for blog performance monitoring, because you’re probably using a variety of measurement tools and it can be hard to keep track of all that data. Jumping from platform to platform is not an efficient way to understand the effectiveness of your content strategy.
With Databox you can build custom dashboards to track and manage the performance of all your metrics in one spot. Tracking performance includes:
- Defining the right metrics and goals
- Automating data gathering
- Monitoring performance in real-time
- Capitalizing on future opportunities
To learn more about how we use Databox here at Nectafy, check out our Databox review article.
Now let’s take a closer look at how Databox makes dashboard creation simple, with just three easy steps:
1 Connect your data.
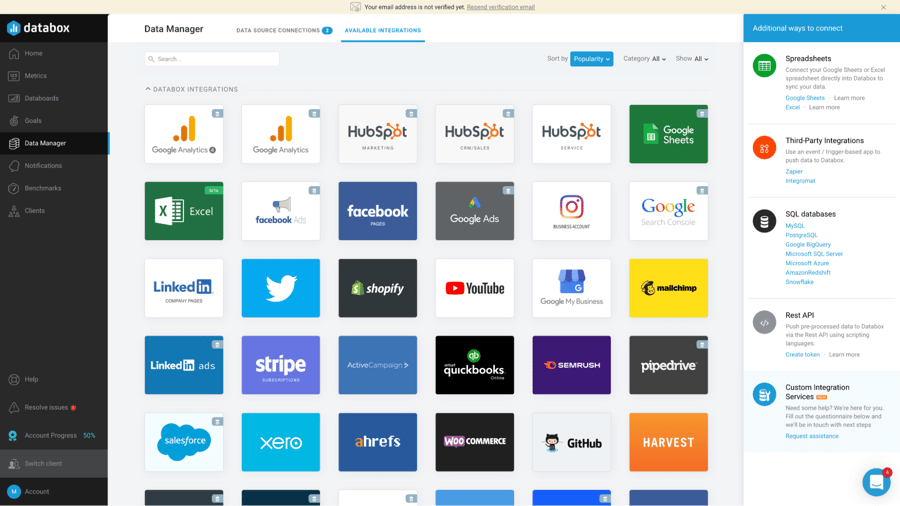
Using the Data Manager, you can connect 70+ data sources, making it possible to view all your blog analytics in one spot.
Connecting your data sources is easy; in just a few clicks you can authenticate your connection and start syncing data to your account.
With each data source connection, you will be able to pick from premade metrics that will facilitate your ability to build custom dashboards and visualize your data.
Databox connects to the most popular blog analytics tools, including Google Analytics, Semrush, Ahrefs, HubSpot, Google Search Console, and much more!
If a data source is not available, you can integrate any data using a Google Sheet or Excel, or by using third-party tools like Integromat and Zapier.
2 Create your dashboard.
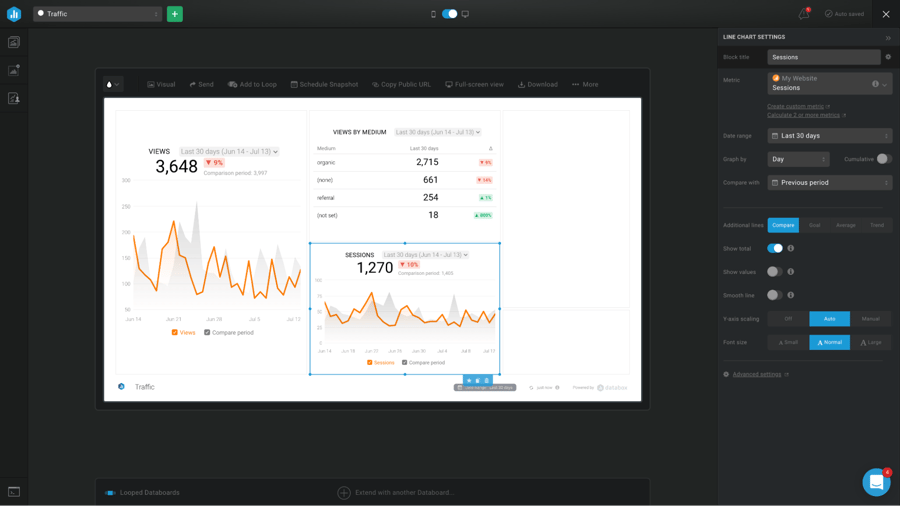
A dashboard is a great way to monitor the performance of your metrics in real-time. With Databox Databoards you can monitor data from more than one platform in a single view.
Building your dashboard is easy; you can make use of basic metrics (premade metrics) to drag and drop the visualizations onto your dashboard.
You can also use its customization capability to modify the chart size, change the date range, filter your data, add goals, rename visualizations, and more. In the Designer the possibilities are endless.
Once you’re done, you can share your dashboards with team members through email, Slack, shareable links, and even stream it to the office TV.
3 Create your notifications.
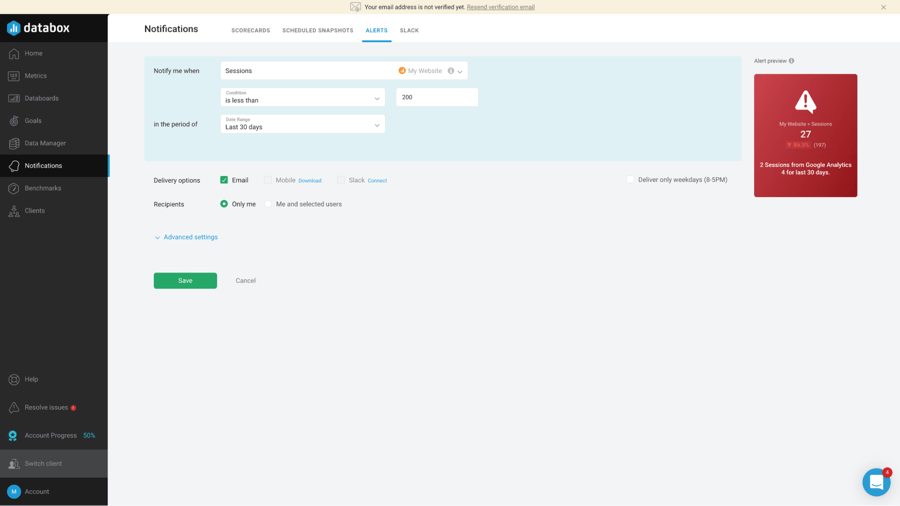
Databox notifications help you automatically track performance and identify emerging trends. Notifications include:
- Scorecards: Monitor up to 15 metrics through daily, weekly or monthly updates.
- Schedule Snapshots: This feature allows you to export your dashboards into your desired format—PDF or JPG—at regular intervals. This is a great way to make data monitoring a regular part of your routine.
- Alerts: Automatically and proactively monitor your data. You can set up alerts to notify you when you have hit your goals or to signal emerging trends. This is a great feature to help your team understand the correlation between your efforts and your results.
Free Dashboard Templates To Track Blog Analytics
With Databox you have access to premade dashboard templates, allowing you to set up your blog analytics board in a matter of minutes.
See below for a few of our favorites:
HubSpot (Blogging Performance) Dashboard Template
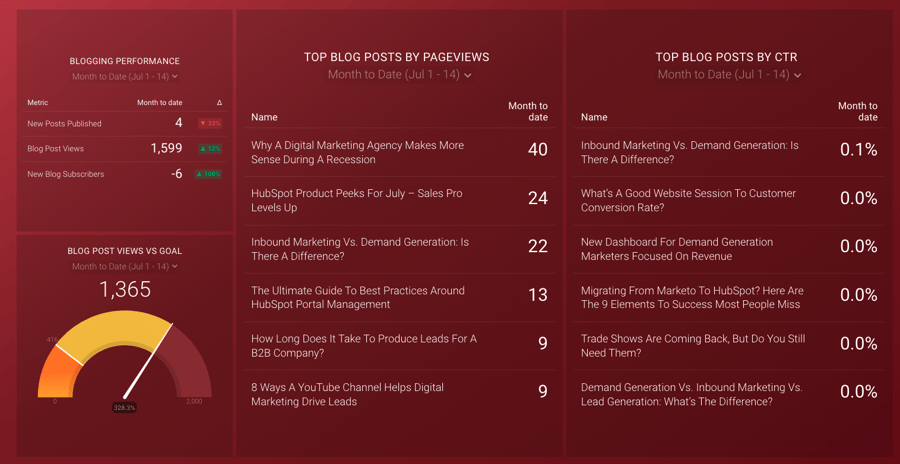
Snippet: Use this dashboard to get a complete view of your blog's performance. It includes key metrics like “total blog views” and “top blog posts by pageviews” that hit the highlights around your blogging efforts.
Integration: HubSpot Marketing
Content Improvement Dashboard Template
Snippet: With this dashboard, you can gain complete visibility over what content improvements should be made across your website.
Integration: Google Analytics and Google Search Console
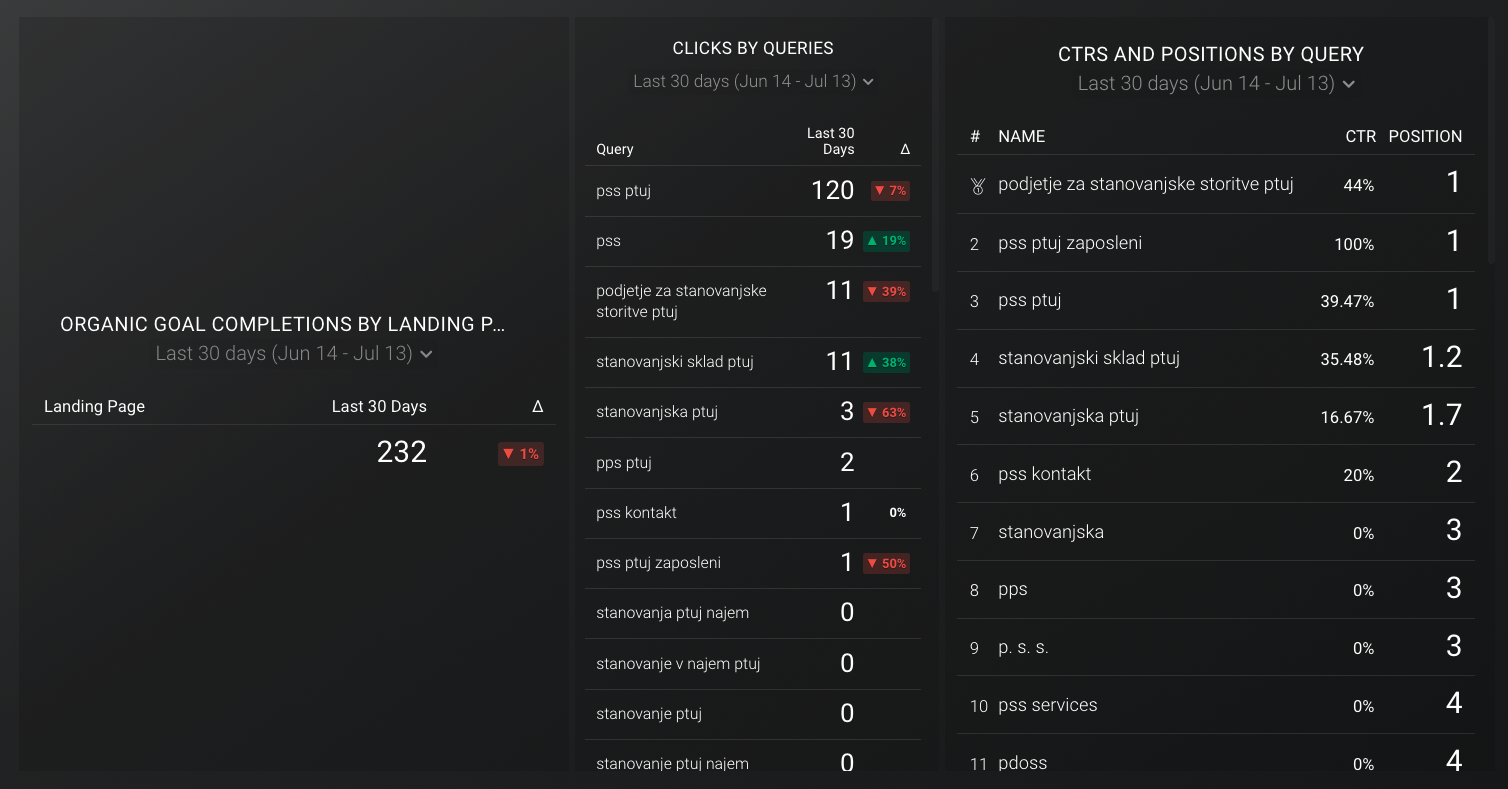
Blog Traffic Distribution Dashboard Template
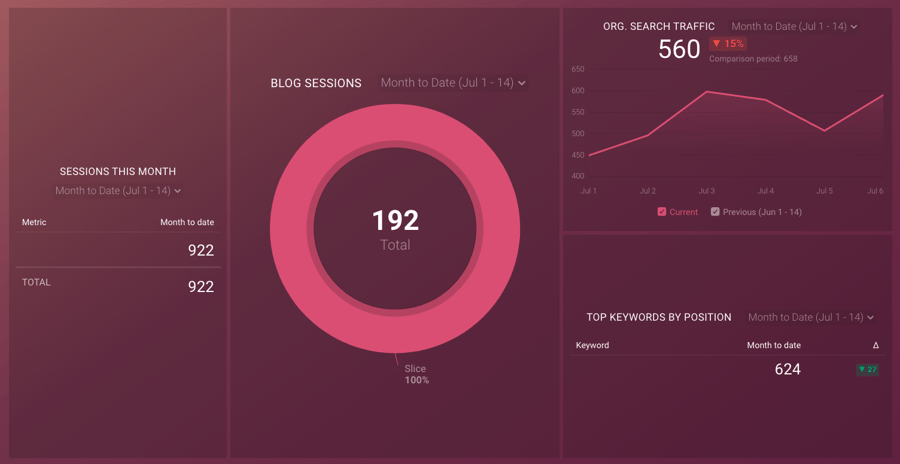
Snippet: This dashboard will help you identify your top-performing articles in organic search. You can also gain insights into ways to improve traffic to your website.
Integration: Google Analytics and Semrush
HubSpot Marketing - Marketer Drilldown (Sessions) Dashboard Template
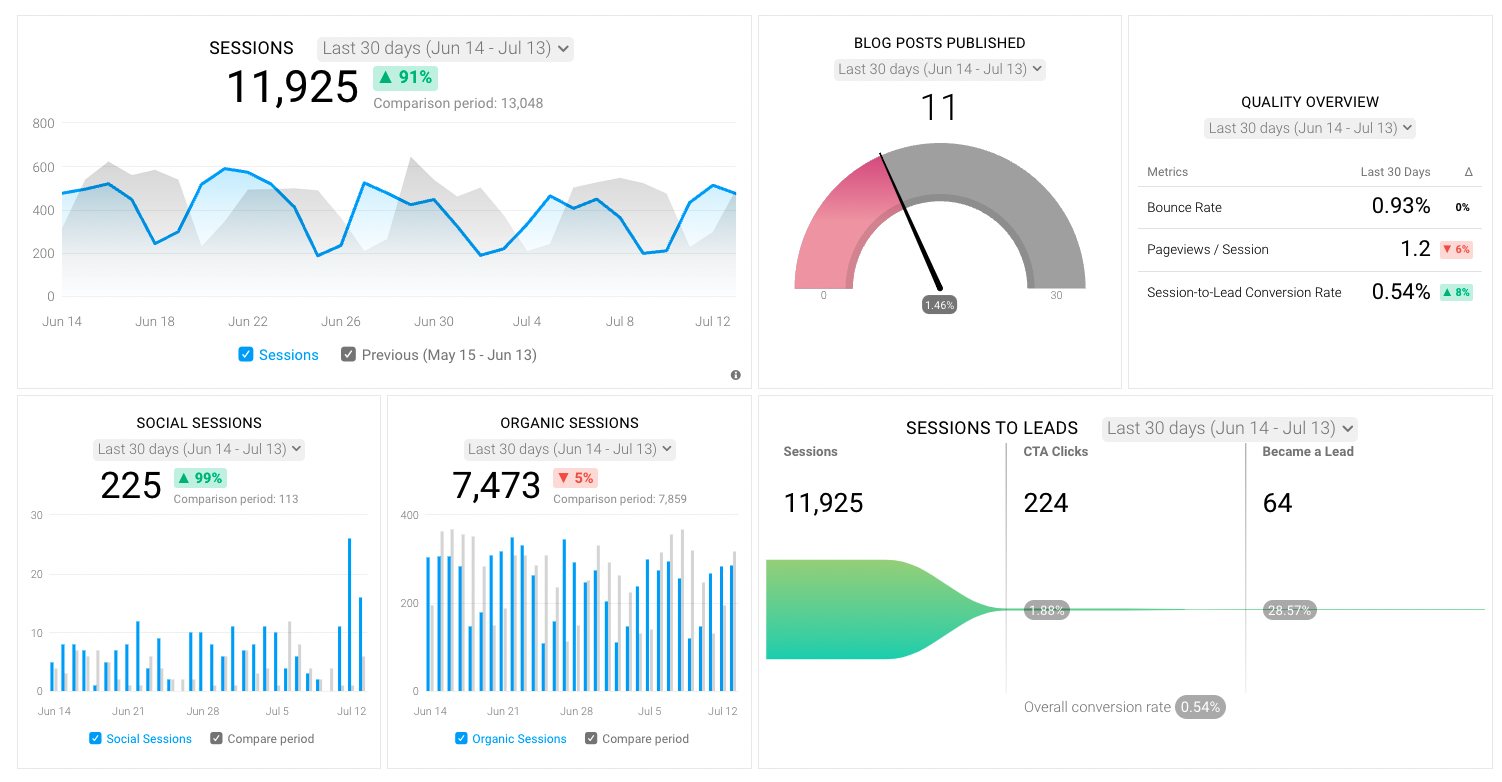
Snippet: You can use this dashboard to better determine the effectiveness of your blogging efforts. By combining quality and quantity metrics, you will gain a better understanding of your audience's behavior and how they interact with your content.
Integration: HubSpot Marketing
Final Thoughts
As I mentioned at the beginning of this post, writing blog content can be challenging. That’s why it’s vital for you to have the proper tools and KPIs in place to help you gauge the success of your content once it’s published. By using the information mentioned throughout this post, you’ll be able to create your own system of blog analytics that will help you do just this.
Don’t have enough time to set up your own blog analytics, let alone plan out multiple blog posts on a monthly basis?
Apply here to make your case for why your company would be a good fit for Nectafy’s growth content services!