
Are you refreshing your monthly stats constantly—clicking that button over and over again each day—to see how your marketing results are trending?
If you find yourself stressing out, wondering whether or not your marketing investment is really paying off, then stop—and take a deep breath.
Those monthly content analytics may not be as big of a deal as you think they are. Below are four scenarios where month-to-month results may drop, and the reasons why it’s not a problem. Before you switch your strategy and go into panic mode, make sure you’re not reacting to a problem that won’t correct itself.
4 Reasons You Don’t Need To Panic If You See A Downward Trend
1. The December Dip
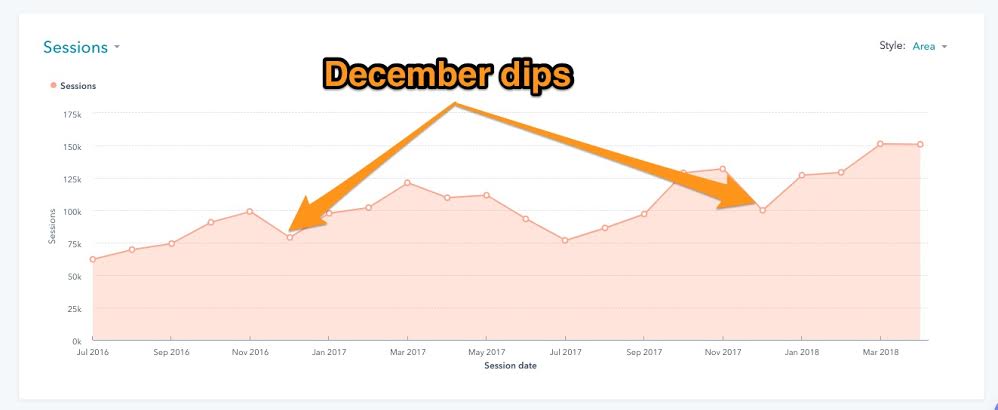
Seeing tanking results in December? Hold off before you blame your marketing strategy—it’s probably the impact of major holidays that month.
What Data Shows
We’ve noticed this with our own marketing as well as our client marketing—it seems to be an annual trend. Take the graph above. In 2016, we saw a 20% drop in visits from November to December, and in 2017, a 24% drop in visits from that same time period. A dip in leads followed the same trend, too.
Keep in mind, the graph above is of a growing website, so that trend would look even worse if traffic was flat for many months prior.
Takeaway
If you haven't been producing content for more than two years, you may not have the sample size you need to know that December isn’t a great month for content marketing. Treat it like a month with only two and a half weeks—even though there are only a few business days off, people aren’t doing research on December 20. Therefore, don't change your strategy because December looks bad. Before you make any decisions based on a December downturn, find a specific problem first; don't just change because sitewide performance is down.
2. Fewer Business Days In A Month
B2B content marketing traditionally shows that significantly more visits come through on weekdays than on weekends. You scoop up some visitors on weekends, but not nearly the quantity or quality of weekdays. So if you have fewer business days in any given month, don’t be shocked to see fewer visits and leads that month.
What Data Shows
The following is a calendar of business/working days in 2018:
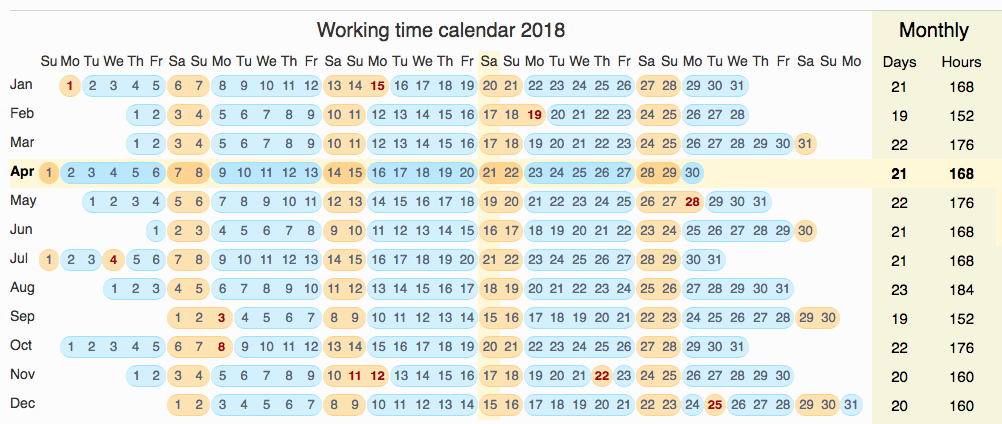
Take a look at January and February to see how this theory plays out in terms of work weeks. January 2018 has 21 business days, and February 2018 has 19 business days. That’s a difference of 9.5%.
The following graph shows how those months impacted one of our clients:
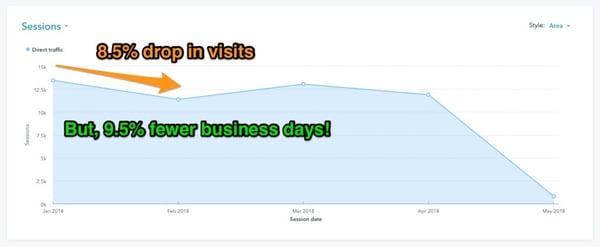
They saw an 8.5% drop in direct visits, but actually had 9.5% fewer business days to work with. What looks like a downturn is actually just flat. Turns out, we just had fewer business days to attract visitors.
Takeaway
If you see a monthly downturn in your content marketing metrics, think about the month’s length, holidays, and business days. These factors can explain any month-to-month discrepancies within about a 10% range.
3. Summer Months Slump
The Google trend chart above shows that certain weeks in July and August are consistently poor performers. Here’s our theory: Content marketing requires your prospects to be proactive in their jobs—in ”I need to find new CRM software for my sales team” mindset, for example. But when people take vacation time, they usually do reactive work before and after the time off—that is, finishing tasks that need to be done before they leave and trying to assign out work that should happen in their absence.
Here’s what that actually looks: Imagine Henry takes a one-week vacation. He’s probably going to stop doing that proactive work (work that doesn’t need to be done before his trip) for at least a week before he leaves. Then, when he returns, he’s not going to immediately jump back into that proactive work—he’s got to get caught up again first. So he won’t be searching for that CRM solution for at least two weeks. It’s a compounding issue that is really prevalent.
Takeaway
While summer months are not as bad as December, they run a close second. If you see these bad months playing out in your content marketing, bear in mind that it just might be that your prospects are on holiday.
4. Previous Monthly Campaigns
When you do monthly reporting, you might get hung up on dips from month to month. When you look at the total results (all visits, all leads), you may see a drop. To see what’s contributing to that drop, break it out your content analytics by source to see what factors are contributing to the issue.
What Data Shows
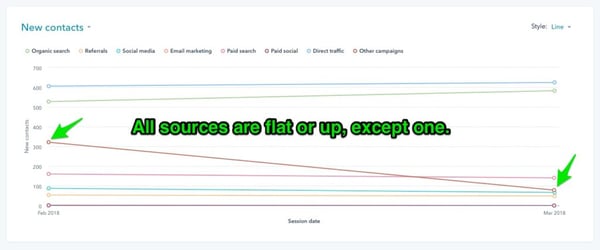
The graphs below indicate data from a specific campaign a client did that was very successful—bringing in hundreds of additional leads in February. March results show that, compared month to month, total leads are down 12%.
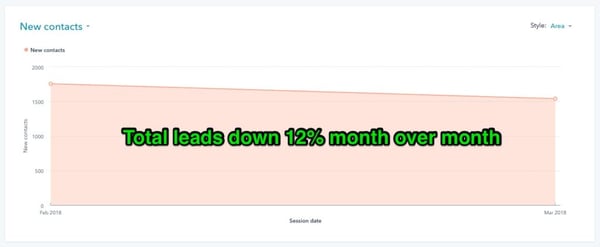
When broken out by source, you can see that all seven sources (see image below) of content metrics are flat or up, and one (other campaigns) is way down.
Takeaway
When you look at the high level during monthly reporting, March looks like a failure. It wasn't! It just appeared that way compared to the previous month because of the artificial bump caused by the campaign in February.
How To Identify If There’s A Real Problem With Your Content Marketing
- Slice the data by source to reveal the problem. For example: Your paid visits dropped. Did you run a test that failed? Did you lower your budget? Did some ads get denied, or did organic traffic fall considerably? Did your high-ranking keywords slip?
- Slice the data by page. Find out if certain pages have dropped in visits month-to-month versus the average drop you're seeing. Those could be a problem—the content may be old and keywords may be slipping.
- Make sure each number you report has some context. Figure out why is there a drop. If you get in the habit of finding these answers, you'll likely find more scenarios you can't control, like the holidays and summertime.
- Make sure your campaigns and tests are organized, dated, and easily accessible. If you did a very successful one-off email campaign in February, identify and quantify exactly how well it performed. Then, make sure it doesn't cloud your March month-to-month comparisons. Yes, March may be down 15% on email exclusively, but up 25% if you remove that one campaign.
Things To Remember Before You Start To Panic
Next time you’re clicking around your monthly reporting and feel a panic attack coming on, make sure you consider these four things about content analytics:
- Don't get hung up on high-level trends month-to-month—they may mislead you.
- Don't be discouraged by major dips in the summer and the month of December—it's normal.
- Anything within a 10% change month-to-month could be impacted by holidays, the number of business days, vacations, etc.
- If you think something is wrong, troubleshoot using the tips above.
Rest assured these monthly blips are often just that—blips. You don’t need to throw your marketing into chaos mode and upend everything you’re doing. If you’re still unsure about what you’re seeing, talk to an expert to make sure your growth content plan is tracking the way it should be.