

The biggest challenge in copywriting today is how to make a connection with all those passing eyes on the internet. Copywriters can take any number of tacks to make that connection—persuasion, humor, psychological, and more—depending on the subject matter, the intended goal, the audience, and even the writer.
But there’s also another tool at our disposal: hard data. Whether your work will appear on the web, on social media, or in email inboxes everywhere, there are copywriting statistics that reveal what’s worked well for those outlets in the past. You can leverage these to help craft and publish your own compelling copy—and hopefully capture a greater share of those wandering eyes.
Culled from a variety of sources, the more than 100 data points we dug up below will be useful for any copywriter whose work regularly appears on a website or blog, social media, or email.
If your company’s website isn’t producing leads, it’s not working as hard as it could be. Download our Growth Content Portfolio to see what effective writing looks like—and how we can help!
99 Revealing Copywriting Statistics
Website/Blog
Blogs are a great way to grow an audience, and a business. But blogging successfully—meaning, your blog actually attracts leads—requires the continuous production of high-quality content that resonates with your readers. Here’s a collection of stats that sheds light on the elements of an effective blog, along with some interesting data points about blog writers and readers.
- Headlines with 10–13 words attract twice as much site traffic.
- Listicles receive 80% more page views than other content marketing types.
- Content with at least one list every 500 words receives 70% more traffic.
- 74% of web readers pay attention to the quality of spelling and grammar.
- Eight out of 10 visitors will only read the headline of a page or article.
- The ideal reading time for a blog post is seven minutes.
- Using a hyphen or colon in the headline increases click-through rates by 9%.
- Each month, approximately 409 million people view more than 20 billion web pages.
- 46% of bloggers edit their own work.
- 54% of bloggers have editors or someone else review their work.
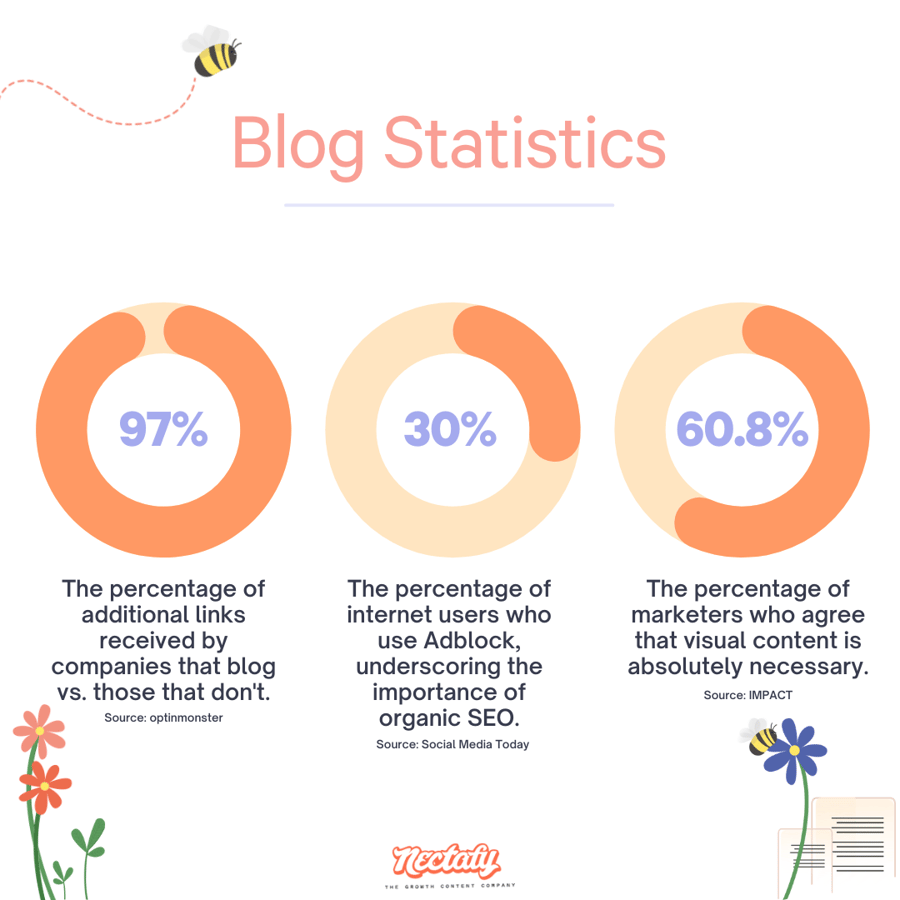
- Companies that blog get 97% more links to their websites.
- 66% of bloggers today publish a few times per month.
- 60% of blogs publish one to five guest posts per month.
- 77% of internet users read blogs.
- Internet users in the U.S. spend three times more time on blogs than on email.
- Only 38% of bloggers update older articles.
- Bloggers who write articles of 2,000+ words are far more likely to have strong results.
- Websites that also have a blog are shown to have 434% more indexed pages.
- Around 5% of bloggers don’t have access to analytics.
- Businesses that blog experience twice as much email traffic.
- 62.96% of readers perceive blogs with multiple authors to be more credible.
- Most bloggers prefer writing how-to articles and list articles.
- 93% of site visitors have left a site due to its poor display on their mobile devices.
- 90% of site visitors abandon a website due to its poor design.
- 53.7% of all freelance copywriters are women, while 46.3% are men.
- The average age of an employed freelance copywriter is 41 years old.
- Freelance copywriters are paid an average annual salary of $49,989.
- 52% of bloggers reported that it was becoming hard to get readers engaged with their content.
- 30% of internet users use Adblock, making organic content important.
- Personalized calls to action (CTAs) increase conversion chances by 202%.
- Pages with one CTA link have a higher average conversion rate.
- Landing page traffic that originates from email produces the highest conversion rate (13%).
- 37% of the top landing pages include testimonials.
- 73% of people admit to skimming rather than reading a blog post.
- The average visitation time for any webpage, regardless of length, is about 15 seconds.
- Readers only consume 20% of content on a page.
- For every additional 100 words on a page, visitors will spend an extra 4.4 seconds.
- 79% of people usually don’t read web copy at all. Instead, they scan and skim.
- Two- to three-letter words are skipped over nearly three out of four times.
- Compelling copy draws 7.8 times more site traffic and produces better brand recall.
- 31.7 % label visual content as “very important.”
- 60.8% of marketers agree visual content is absolutely necessary.
- 46% agree that photography is crucial to their campaigns.
- Colorful visuals make readers 80% more likely to read a document.
- Readers spend an average of 37 seconds on an article.
- 56% of marketers believe it’s necessary to increase quality content to keep up with the competition.
- Long-form articles generate nine times more leads.
- 36% of readers prefer list-based titles.
- Odd-numbered listicle headlines outperform even ones by 20%.
- Users that spent a minute reading an opinion article were 45% more likely to agree with the author.
- 66% of reader attention is spent below the fold.
- Adding the word “because” with a reason to your CTAs can increase compliance by 34%.
- 59% of users would avoid buying from a business that made spelling or grammar mistakes.
- Having more than a single offer on a landing page can decrease conversion rates by 266%.
- Positive headlines have the power to provide a 10% increase in clicks from internet users.
- The average person reads 25% slower on screens than on paper.
Social Media
Social media copywriting helps businesses build a true community around their brand. It lets you interact directly with consumers by creating polls, asking questions, or posting videos/stories. Essentially, social media is a great way to stoke a conversation, and keep it going. Here are some stats that’ll help you do it right:
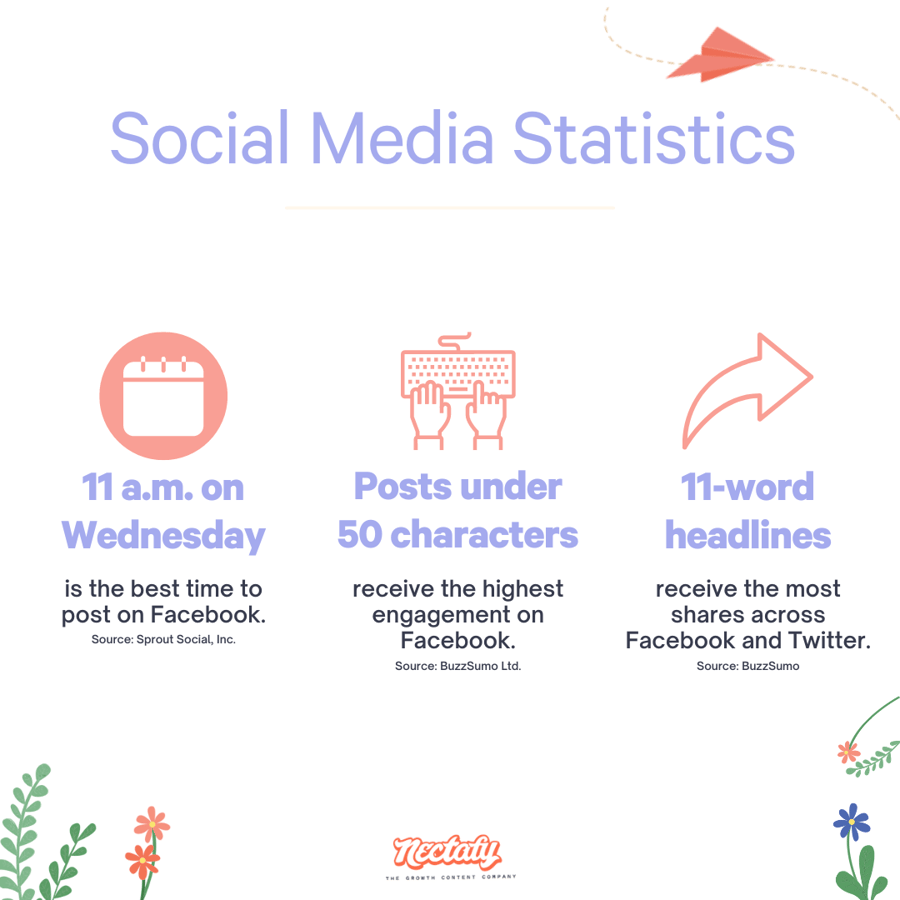
- The best time to post on Facebook is Wednesday at 11 a.m.
- 99% of the social target audience accesses social media platforms via a mobile phone.
- Almost 99% of global internet users ages 16–64 use a social network.
- Internet users spend an average of two hours and 22 minutes on social media each day.
- Eleven–word headlines receive the most shares across Facebook and Twitter.
- 52% of people prefer visual content that is three to six minutes long.
- 45% of people find instructional and informational videos by internet search.
- 85% of marketers rank short-form videos as most effective social media content in 2021.
- 64% of marketers plan to invest more in short-form video in 2022.
- 82% of marketers repurpose content across various social media channels.
- 83% of marketers believe the quality of social media posts is more important than the quantity.
- 54% of social browsers use social media to research products.
- 96% of consumers have watched a posted video to learn more product information.
- Facebook posts under 50 characters receive the highest engagement.
- Hashtags increase twitter engagement by nearly 50% for brands and 100% for individuals.
- Facebook posts with photos earn 53% more likes.
- Facebook posts with photos earn 104% more comments and 84% more click-throughs.
Email is a helpful way to sustain interest in your site. Through thoughtfully crafted messages, existing customers feel valued and looked after. And, new recipients feel welcomed into your community. The following stats can help you do this more effectively, and gauge your success:
- 60% of consumers made a purchase in response to promotional emails they received.
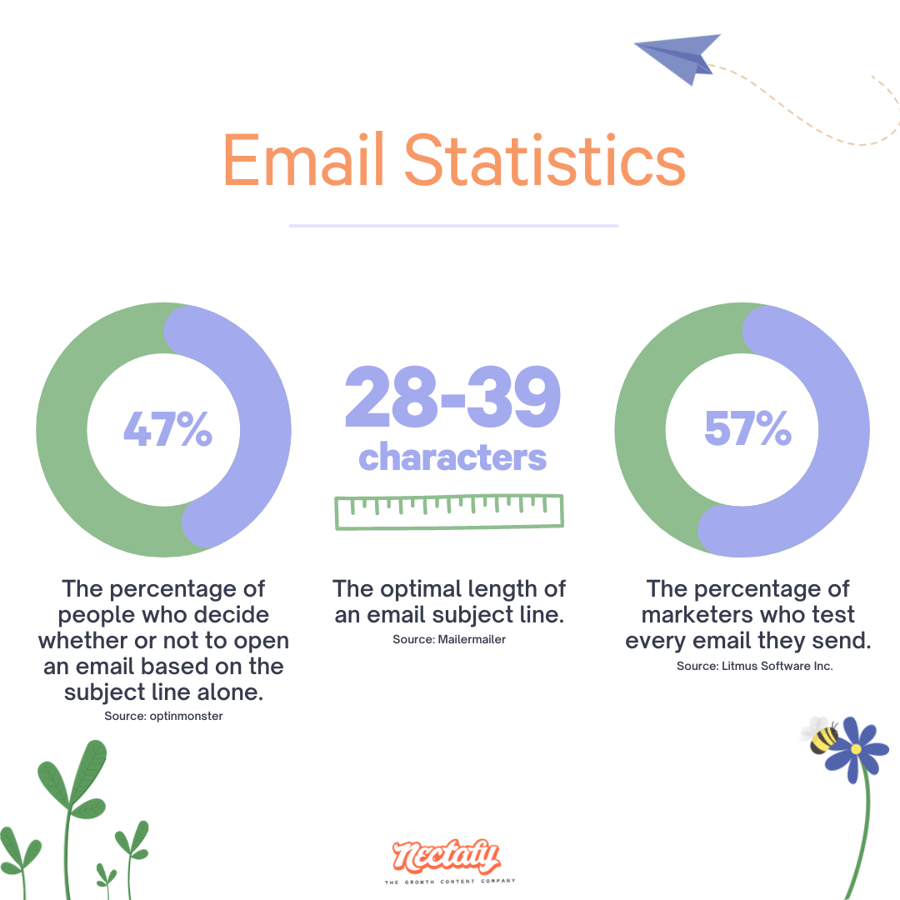
- 47% of people decide whether or not to open an email based on the subject line alone.
- 69% of people will report an email as spam based on the subject line alone.
- Personalized subject lines boost open rates by 10–14%.
- The average open rate of an email is 18%.
- The average click-through rate (CTR) of an email is 2.6%.
- Fridays are the best days to email for high conversion; Saturdays are the worst.
- The average email open rate across all industries is 21.33%.
- The industry average email click-through rate is 2.13%.
- Email subject lines have 43.85 characters on average.
- The optimal length of an email subject line is 28–39 characters.
- Emails from experts contain an average of 434.48 words.
- 64% of small businesses claim their email copy is effective or very effective.
- Internet users worldwide send and receive 319.6 billion emails each day.
- Email newsletters are the top content type used by 77% of B2B marketers.
- 72% of people use email marketing to promote offerings and communicate with audiences.
- Of all who use email marketing, 94.6% consider it important to their strategy.
- 36.1% say email marketing is the best strategy to drive sales.
- 43.5% of all emails are opened on a mobile device, and 86.8% of those devices are iPhones.
- Email marketing has the highest ROI of any digital marketing channel.
- "Too many emails" is the main reason why readers unsubscribe from an email list or report it as spam.
- 57% of marketers test every email they send.
- Companies that A/B test their emails see 37% higher ROIs.
- Social proof can increase newsletter signups by 20%.
- Adding two extra words to an email subject line can increase the open rate by 23.8%.
Need help crafting high-quality content? Download our Growth Content Portfolio to see some of the lead-generating copywriting Nectafy has done for our clients, or reach out if you’re interested in working with us.
Sources: The State Of Content Marketing (Semrush); How To Write Headlines That Work (Copyblogger); Poor grammar on websites scares 59% away.....How much business lost?; The Ideal Length of Everything Online, Backed by Research (Buffer); Ultimate List of Blogging Statistics and Facts (Updated for 2022) (Optinmonster); How to Explode Traffic by Updating Outdated SEO (Optinmonster); New Blogging Statistics: Survey of 1067 Bloggers Shows Which Content Strategies are Working in 2021 (Orbit Media Studios); Web Design Statistics 2020 (Sitejet); Freelance Copywriter Demographics & Statistics In The U.S. (Zippia); Concise, Scannable, and Objective: How to Write for the Web (NNG); Global Ad Blocking Behavior 2019 [Infographic] (Social Media Today); Personalized Calls to Action Perform 202% Better Than Basic CTAs [New Data] (HubSpot); [Infographic] The Data Behind Landing Page Trends in 2018 (Unbounce); Local Landing Page Study: What’s happening in 2018 (Nifty); Content Trends: Preferences Emerge Along Generational Fault Lines (HubSpot); 10 Visual Content Marketing Statistics to Know for 2017 [Infographic] (Impact); A Copywriter Service: Skilled Precision in Driving Traffic to Your Site (Copywriter Today); 20 Ways to Share Color Knowledge (Xerox); Data From 10,000 Articles Prove That Content Marketing Really Does Work (NewsCred Insights); 2015 CONTENT MARKETING TACTICS & TECHNOLOGY PLANNER (Curata); Increase Content Marketing Success With Helpful Headline Tips & Tools (Content Marketing Institute); 5 Tips to Improve Your Headline Click-through Rate (Content Marketing Institute); What You Think You Know About the Web Is Wrong (Time); How Engaged Time Affects Reading Comprehension (Chartbeat); The Power of the Word "Because" to Get People to Do Stuff (Psychology Today); 11 Stats: Why Your Landing Page Doesn’t Convert [Slideshare] (Wishpond); Headline Optimization (Marketing Experiments); How Little Do Users Read? (NNG); Eye-Tracking (Richardson); The best times to post on social media in 2022 (Sprout Social); 100m Articles Analyzed: What You Need To Write The Best Headlines [2021] (BuzzSumo); Video Statistics, Habits, and Trends You Need To Know [2021 UPDATE!] (TechSmith); 80+ Essential Social Media Marketing Statistics for 2022 (HubSpot); Social Browsers Engage with Brands (GWI); Video Marketing Statistics 2022 (Wyzowl); The Ultimate Guide to Facebook Engagement in 2017 (BuzzSumo); Best practices for journalists (Twitter); How to get more Likes on Facebook (Kissmetrics); 10 Email Marketing Statistics You Need to Know (Constant Contact); 164 Best Email Subject Lines And Why They Work! (2022) (Optinmonster); Ultimate Email Marketing Benchmarks for 2022: By Industry and Day (Campaign Monitor); 2022 Email Marketing Statistics and Benchmarks by Industry (Mailchimp); 2022 Email Marketing Benchmarks (GetResponse); How Long Should an Email Be? (AWeber); Email Market, 2021-2025 (Radicati Group); B2B Content Marketing: Benchmarks, Budgets, & Trends (Content Marketing Institute); 2021 Digital Marketing Report for Entrepreneurs & Small Business (AWeber); Email client market share in 2020: What’s most popular? [Infographic] (Litmus); Why Consumers Subscribe and Unsubscribe from Email [New Data] (HubSpot); The Email Risk That 43% of Companies Are Taking (Litmus); How the World’s Best Email Brands Run A/B Tests (Litmus); 5 Unknown Tips To Hack Your Retargeting (Unbounce); How small copywriting changes can lead to big increases in conversions (Econsultancy).